
Data & analytics
Put the decision next to the data.
Start with the question someone needs to answer. We trace the records behind it, check how they are measured and design a view that helps a person investigate what happened.
Discuss a data project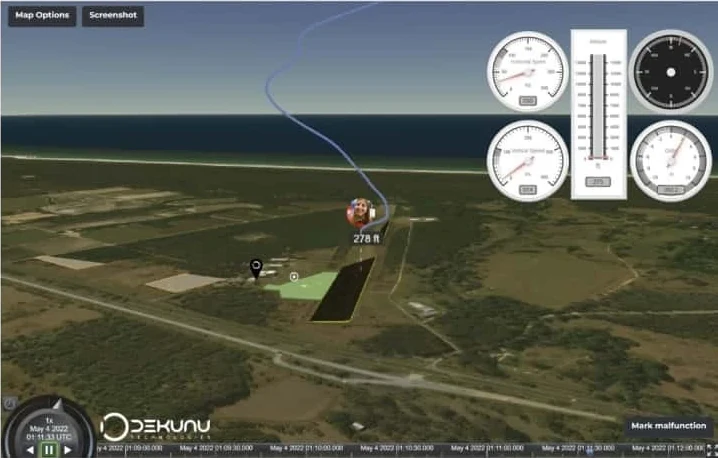
The engagement
What you get
Agreed measures
Define the calculation, source and owner of each metric. Check how missing, late or corrected records affect the result.
A reporting pipeline
Connect source systems, transform records and flag data quality issues before they appear in a report.
A decision tool
Shape the view to the question, from an operations dashboard to a mapped journey or a comparison across events.
From our work
Seeing a jump in context
Dekunu Cloud brought jump records, statistics and 3D flight paths together. Skydivers could inspect an individual path and compare it with their previous jumps.
Explore Dekunu Cloud